Net Assets
Consolidated balance sheet structure
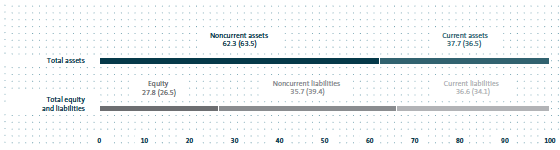
At €324.3 billion, the Volkswagen Group’s total assets as of December 31, 2013 exceeded the prior-year figure by 4.8%. The structure of the consolidated balance sheet as of the reporting date can be seen from the chart on page 102. The Volkswagen Group’s equity ratio rose slightly to 27.8% (26.5%).
As of the end of the fiscal year, the Group had off-balance-sheet liabilities in the form of contingent liabilities in the amount of €4.2 billion (€4.6 billion) and other financial obligations in the amount of €24.4 billion (€22.1 billion). The latter primarily result from purchase commitments for property, plant and equipment, as well as obligations under long-term leasing and rental contracts and irrevocable credit commitments to customers.
CONSOLIDATED BALANCE SHEET STRUCTURE 2013
in percent
Automotive Division balance sheet structure
The Automotive Division’s noncurrent assets – in particular intangible assets – were on a level with the previous year at the end of the reporting period. Property, plant and equipment rose by 6.9%. Within the other noncurrent assets item, equity-accounted investments rose sharply from €5.4 billion to €7.6 billion due to the acquisition of the LeasePlan interest and the strong performance of the Chinese joint ventures. Current assets were up 11.5% year-on-year; within this item, trade receivables rose by 12.8% as a result of the increase in business. Cash and cash equivalents amounted to €20.5 billion as of December 31, 2013, €5.0 billion higher than in the previous year. Following the approval by the Annual General Meeting of MAN SE of the control and profit and loss transfer agreement, a liability was recognized for the obligation to acquire the shares held by the remaining free float shareholders of MAN in accordance with the cash settlement offer in the amount of €3.1 billion. This did not affect liquidity. Equity was reduced accordingly; the noncontrolling interests in MAN SE were derecognized. The remaining noncontrolling interests are largely attributable to Scania shareholders.
The Automotive Division’s equity amounted to €76.0 billion at the end of 2013, up 10.7% on the prior-year figure. The increase was attributable to positive earnings growth, lower actuarial losses from the measurement of pension provisions, the issuance of a mandatory convertible note and the hybrid notes, as well as positive effects from the fair value measurement of derivative financial instruments. Effects from the derecognition of the noncontrolling interests in MAN SE, dividend payments and foreign exchange differences had an offsetting effect. The division’s equity ratio rose year-on-year to 39.8% (37.9%).
At €65.3 billion, noncurrent liabilities declined by 4.8% as against December 31, 2012. This figure includes provisions for pensions, which decreased by €2.1 billion to €21.5 billion as a result of the actuarial remeasurement. Following the derecognition of the noncontrolling interests in MAN, a liability in the amount of €3.1 billion was recognized under the position “Put options and compensation rights granted to noncontrolling interest shareholders” in current liabilities for the obligation to acquire the shares held by the remaining free float shareholders of MAN in accordance with the cash settlement offer. Following the opening of the award proceedings in connection with the control and profit and loss transfer agreement with MAN SE, this obligation had to be increased by the expected present value of the minimum statutory interest rate in the amount of €0.5 billion. Current liabilities were up on the previous year at €49.5 billion (€43.7 billion). The increase was mainly attributable to reclassifications from noncurrent to current liabilities due to shorter remaining maturities. The figures for the Automotive Division also contain the elimination of intragroup transactions between the Automotive and Financial Services divisions. As the current financial liabilities for the primary Automotive Division were lower than the loans granted to the Financial Services Division, a negative amount was disclosed for the reporting period.
Total assets were €190.8 billion as of December 31, 2013, 5.4% higher than at year-end 2012.
|
PASSENGER CARS BUSINESS AREA BALANCE SHEET STRUCTURE |
||||||
|
€ million |
2013 |
2012* | ||||
|---|---|---|---|---|---|---|
|
|
|
|
||||
|
||||||
|
Noncurrent assets |
94,873 |
90,844 |
||||
|
Current assets |
50,146 |
42,949 |
||||
|
Total assets |
145,019 |
133,794 |
||||
|
Equity |
60,494 |
49,154 |
||||
|
Noncurrent liabilities |
52,900 |
54,608 |
||||
|
Current liabilities |
31,625 |
30,032 |
||||
At €94.9 billion, noncurrent assets in the Passenger Cars Business Area were up 4.4% on the prior-year figure. This was attributable to the increase in property, plant and equipment as a result of the comprehensive investment program, as well as an increase in equity-accounted investments from the acquisition of the LeasePlan interest and the positive performance of the Chinese joint ventures. Current assets rose by 16.8% to €50.1 billion, mainly due to the increase in cash and cash equivalents. Total assets amounted to €145.0 billion (€133.8 billion) as of December 31, 2013.
Equity rose by 23.1% to €60.5 billion. Noncurrent liabilities declined by 3.1%, while current liabilities rose by 5.3%.
|
COMMERCIAL VEHICLES/POWER ENGINEERING BUSINESS AREA BALANCE SHEET STRUCTURE |
||||||
|
€ million |
2013 |
2012* | ||||
|---|---|---|---|---|---|---|
|
|
|
|
||||
|
||||||
|
Noncurrent assets |
27,565 |
28,807 |
||||
|
Current assets |
18,174 |
18,333 |
||||
|
Total assets |
45,739 |
47,140 |
||||
|
Equity |
15,490 |
19,473 |
||||
|
Noncurrent liabilities |
12,390 |
13,994 |
||||
|
Current liabilities |
17,859 |
13,673 |
||||
At the end of the reporting period, noncurrent assets in the Commercial Vehicles/Power Engineering Business Area were down year-on-year, while current assets were on a level with the previous year. Total assets declined slightly to €45.7 billion (€47.1 billion).
At €15.5 billion, equity was 20.5% lower than the prior-year figure. In connection with the control and profit and loss transfer agreement with MAN SE, equity was reduced by the €3.1 billion obligation to acquire the shares held by the remaining free float shareholders of MAN, which was recognized as a current liability. The expected present value of the minimum statutory interest rate (€0.5 billion) was also reported under this item. Noncurrent liabilities declined as against December 31, 2012, while current liabilities were 30.6% higher at the end of fiscal year 2013.
Financial Services Division balance sheet structure
The Financial Services Division’s total assets amounted to €133.6 billion on December 31, 2013, 3.9% higher than at year-end 2012.
Both leasing and rental assets and noncurrent financial services receivables rose as a result of the increase in business. The sale of the interest in LeasePlan led to a decline in equity-accounted investments. Overall, noncurrent assets increased by 3.8% compared with December 31, 2012. Current assets rose by 4.0%. Current financial services receivables increased by €1.4 billion to €39.2 billion. The Financial Services Division accounted for 41.2% of the Volkswagen Group’s assets at the end of fiscal year 2013.
At €14.1 billion, the Financial Services Division’s equity at the reporting date was up 5.1% on the previous year due to an improved earnings situation. The division’s equity ratio rose to 10.5% (10.4%). The shorter remaining maturities of financial liabilities in particular saw noncurrent liabilities decline by 5.6% as against year-end 2012, while current liabilities rose by 11.8%. Deposits from direct banking business amounted to €23.3 billion (€23.9 billion); of this figure, €22.3 billion was attributable to Volkswagen Bank direct. The debt to equity ratio remained unchanged at 8:1.
|
CONSOLIDATED BALANCE SHEET BY DIVISION AS OF DECEMBER 31 |
||||||||||||||||||||||
|
|
VOLKSWAGEN GROUP |
AUTOMOTIVE1 |
FINANCIAL SERVICES | |||||||||||||||||||
|---|---|---|---|---|---|---|---|---|---|---|---|---|---|---|---|---|---|---|---|---|---|---|
|
€ million |
2013 |
20122 |
2013 |
20122 |
2013 |
20122 | ||||||||||||||||
|
|
|
|
|
|
|
| ||||||||||||||||
|
||||||||||||||||||||||
|
Assets |
|
|
|
|
|
| ||||||||||||||||
|
Noncurrent assets |
202,141 |
196,457 |
122,438 |
119,651 |
79,704 |
76,805 |
||||||||||||||||
|
Intangible assets |
59,243 |
59,112 |
59,007 |
58,890 |
236 |
222 |
||||||||||||||||
|
Property, plant and equipment |
42,389 |
39,424 |
40,632 |
38,004 |
1,757 |
1,420 |
||||||||||||||||
|
Leasing and rental assets |
22,259 |
20,034 |
2,642 |
2,667 |
19,617 |
17,367 |
||||||||||||||||
|
Financial services receivables |
51,198 |
49,785 |
–602 |
–602 |
51,800 |
50,387 |
||||||||||||||||
|
Other receivables and financial assets3 |
27,053 |
28,101 |
20,759 |
20,693 |
6,294 |
7,409 |
||||||||||||||||
|
Current assets |
122,192 |
113,061 |
68,320 |
61,282 |
53,872 |
51,779 |
||||||||||||||||
|
Inventories |
28,653 |
28,674 |
25,580 |
25,868 |
3,073 |
2,806 |
||||||||||||||||
|
Financial services receivables |
38,386 |
36,911 |
–844 |
–911 |
39,229 |
37,822 |
||||||||||||||||
|
Other receivables and financial assets |
23,483 |
21,555 |
16,458 |
15,166 |
7,025 |
6,389 |
||||||||||||||||
|
Marketable securities |
8,492 |
7,433 |
6,675 |
5,697 |
1,817 |
1,736 |
||||||||||||||||
|
Cash, cash equivalents and time deposits |
23,178 |
18,488 |
20,450 |
15,462 |
2,728 |
3,026 |
||||||||||||||||
|
Total assets |
324,333 |
309,518 |
190,758 |
180,934 |
133,576 |
128,584 |
||||||||||||||||
|
|
|
|
|
|
|
|
||||||||||||||||
|
Equity and Liabilities |
|
|
|
|
|
| ||||||||||||||||
|
Equity |
90,037 |
81,995 |
75,984 |
68,627 |
14,053 |
13,369 |
||||||||||||||||
|
Equity attributable to Volkswagen AG shareholders |
85,730 |
77,682 |
72,100 |
64,707 |
13,630 |
12,975 |
||||||||||||||||
|
Equity attributable to Volkswagen AG hybrid capital investors |
2,004 |
– |
2,004 |
– |
– |
– |
||||||||||||||||
|
Equity attributable to Volkswagen AG shareholders and hybrid capital investors |
87,733 |
77,682 |
74,103 |
64,707 |
13,630 |
12,975 |
||||||||||||||||
|
Noncontrolling interests4 |
2,304 |
4,313 |
1,881 |
3,919 |
423 |
394 |
||||||||||||||||
|
Noncurrent liabilities |
115,672 |
121,996 |
65,290 |
68,603 |
50,382 |
53,394 |
||||||||||||||||
|
Noncurrent financial liabilities |
61,517 |
63,603 |
15,913 |
15,069 |
45,604 |
48,534 |
||||||||||||||||
|
Provisions for pensions |
21,774 |
23,939 |
21,481 |
23,628 |
293 |
312 |
||||||||||||||||
|
Other noncurrent liabilities5 |
32,380 |
34,454 |
27,896 |
29,907 |
4,484 |
4,548 |
||||||||||||||||
|
Current liabilities |
118,625 |
105,526 |
49,484 |
43,704 |
69,141 |
61,822 |
||||||||||||||||
|
Put options and compensation rights granted to noncontrolling interest shareholders |
3,638 |
– |
3,638 |
– |
– |
– |
||||||||||||||||
|
Current financial liabilities |
59,987 |
54,060 |
–3,981 |
–2,544 |
63,968 |
56,604 |
||||||||||||||||
|
Trade payables |
18,024 |
17,268 |
16,582 |
15,663 |
1,441 |
1,606 |
||||||||||||||||
|
Other current liabilities |
36,976 |
34,198 |
33,245 |
30,586 |
3,731 |
3,612 |
||||||||||||||||
|
Total equity and liabilities |
324,333 |
309,518 |
190,758 |
180,934 |
133,576 |
128,584 |
||||||||||||||||